Reading your rating graph: tilt, plateaus, and real progress
Your rating graph tells a story, but most players read the wrong chapter. Here is how to see past the daily noise to what is actually happening.
The rating number at the top of your profile is the least useful thing about your rating. What actually tells you how you are doing is the shape of the curve over time, and learning to read that shape is one of the cheapest improvements you can make, because it changes how you react to results.
Most short-term movement is noise
The first thing to accept is that day-to-day swings are mostly variance, not skill. Rating systems are designed so that an evenly matched game is close to a coin flip, which means short losing runs are guaranteed to happen even if you are playing exactly as well as always. A fifty point drop over an evening usually says nothing about your ability. If you treat every dip as evidence that you are “getting worse,” you will start tinkering with things that were never broken. Zoom out. One evening is a rounding error on a curve that matters in months.
Tilt spirals are the real damage
The genuinely destructive pattern is the tilt spiral, the near-vertical cliff you see when a player loses once and keeps playing to “win it back.” Each loss makes the next game worse, because you are now playing angry, fast, and without focus. A tilt spiral can erase weeks of gains in an hour, and it is completely self-inflicted. The fix is not a chess fix at all. It is recognising the pattern on your own graph, learning the feeling that precedes it, and closing the app after two or three losses in a row. Nothing you learn about openings will help as much as simply not playing the next game when you are on tilt.
Plateaus are normal, and usually mean one thing
The long flat stretches worry people the most, but they are the most normal feature of any improving player’s graph. A plateau usually means your current approach has reached its ceiling. Whatever got you to this level, better tactics, a solid opening, faster play, has been fully absorbed, and the next jump requires fixing a specific weakness rather than just playing more. Plateaus very often come right before a step up, because the work you do to break one tends to unlock a new level all at once.
What real progress looks like
Real improvement is not the newest number and it is not the daily wiggles. It is the slow trend of your peaks and your floors over months. Are your good weeks better than they were three months ago? Is the level you fall back to after a bad run higher than it used to be? That rising floor is the clearest sign of genuine progress, and it is invisible if you only ever look at today.
Reading your curve in Statmate
Statmate’s Rating History plots your full rating journey and gives you the controls to read it properly. You can filter to a single format, since your bullet and rapid curves tell different stories, and zoom the time range from the last week out to your entire history, which is exactly the “zoom out” move that separates noise from trend. Peaks are marked so you can see your true ceiling, and premium annotations flag win streaks and rough patches directly on the line.
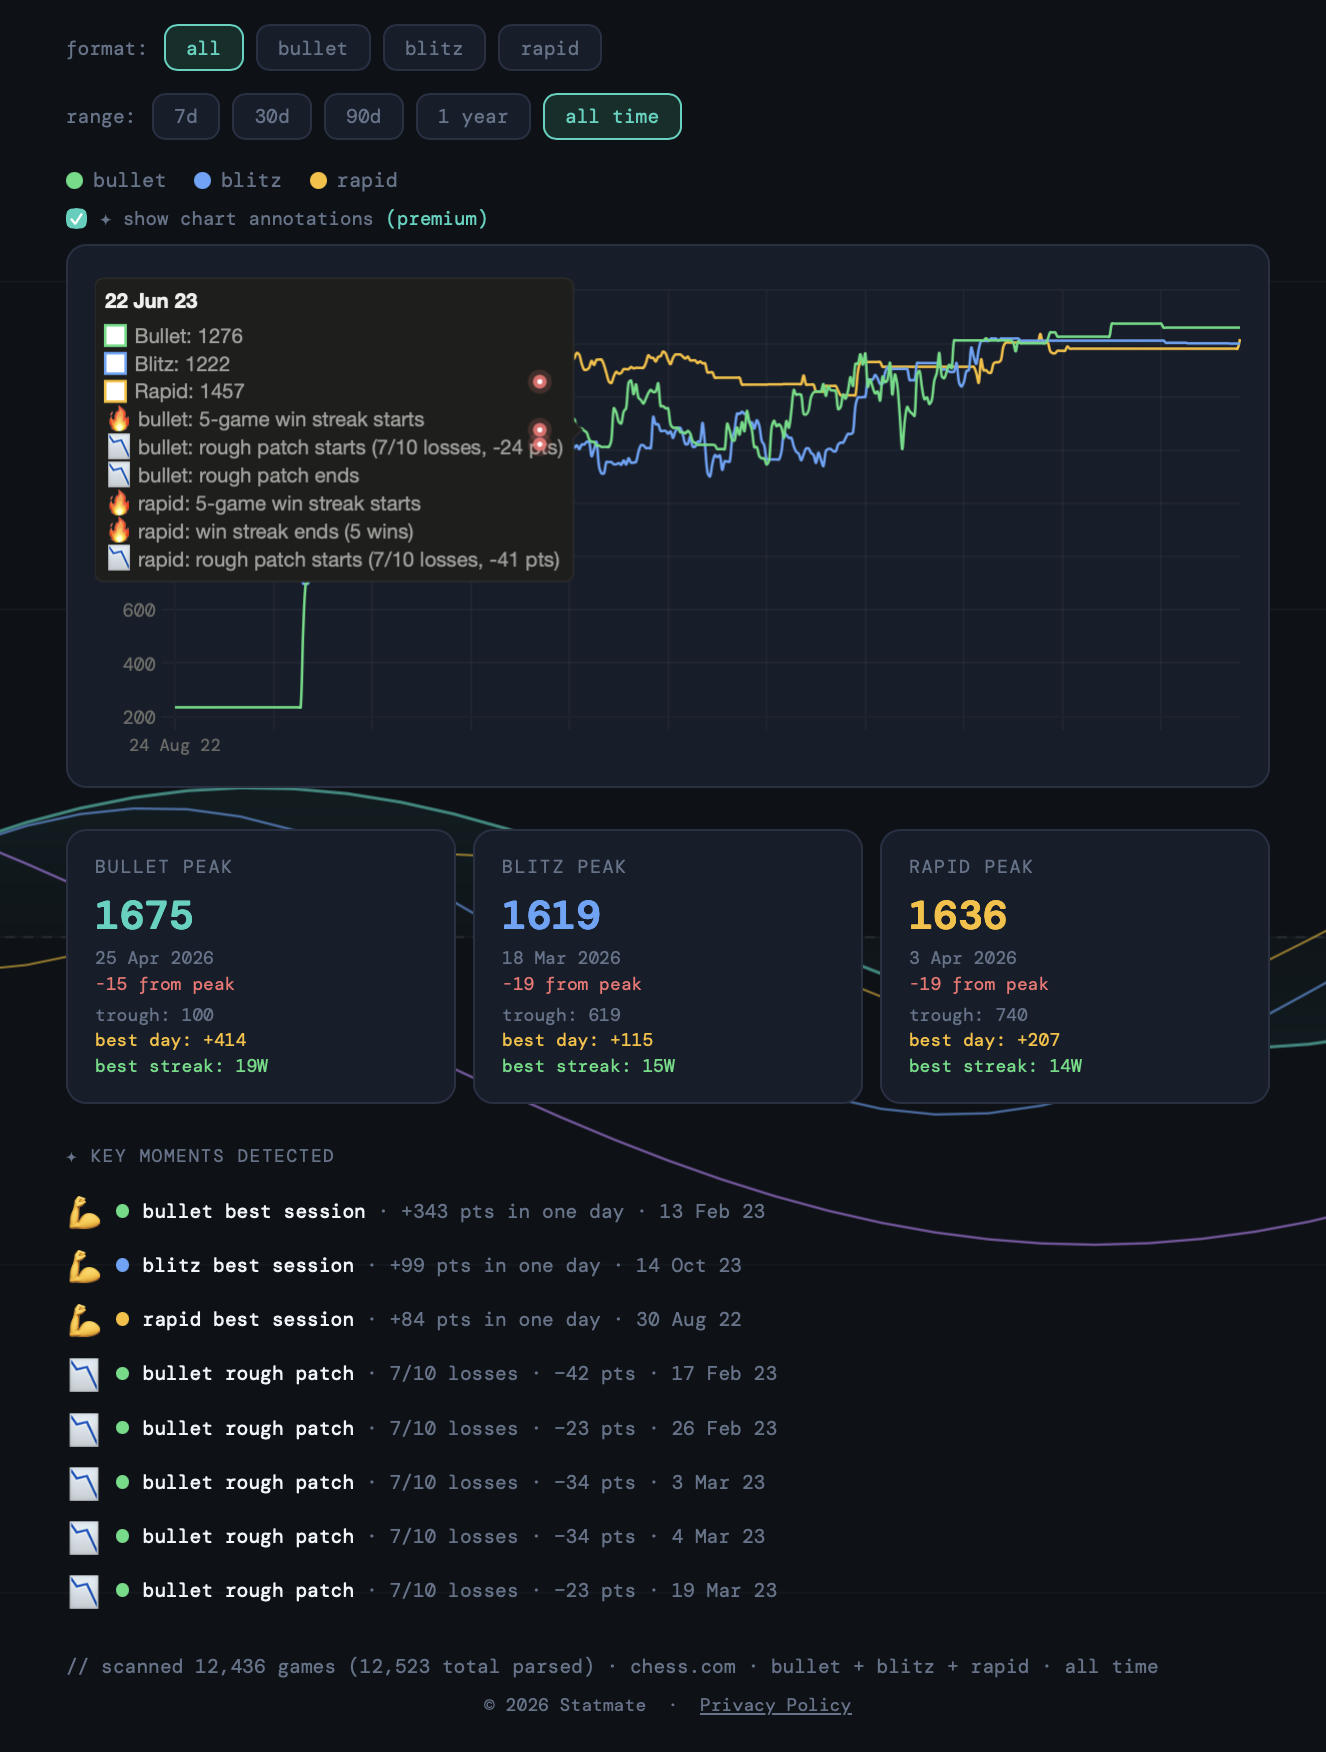
A key moments feed and, over on the Insights tab, a rating leak detector go a step further and flag the specific patterns, such as tilt runs, that are quietly draining points, so you know exactly which habit to break.